Explore data in notebooks
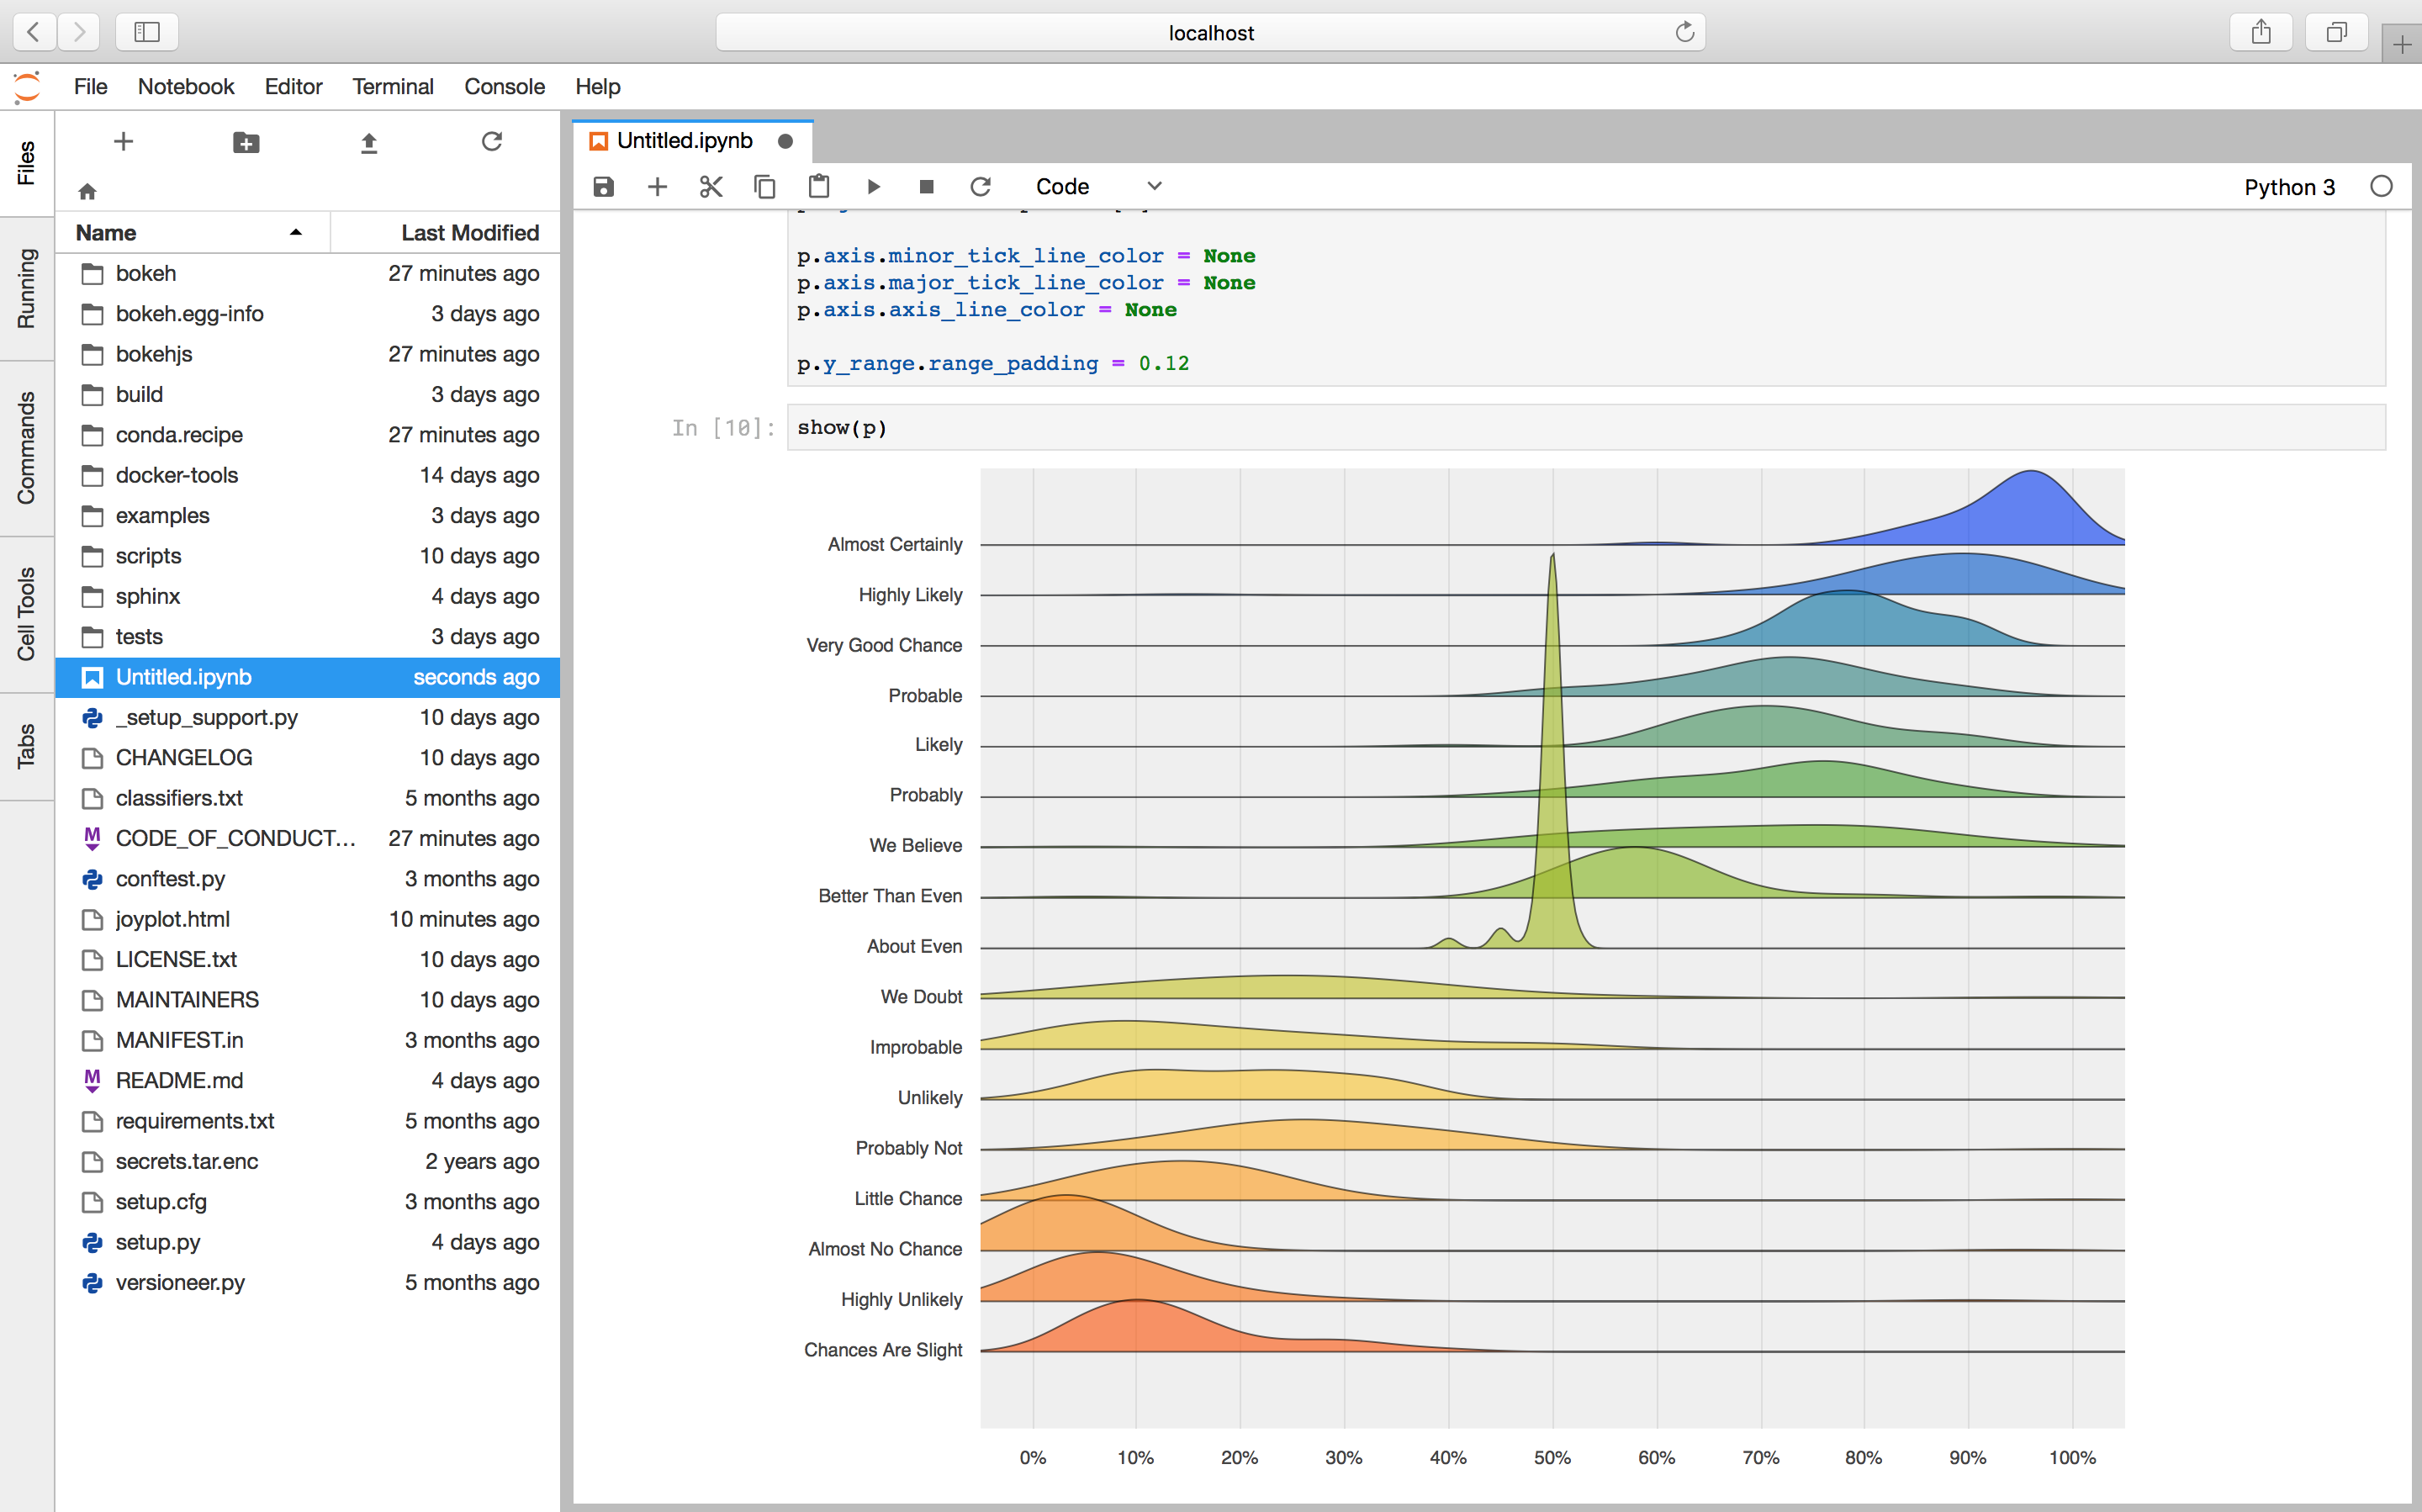
Place interactive plots beside your analysis in Jupyter notebooks and JupyterLab.
Use Bokeh in JupyterInteractive visualization for Python
Bokeh is a Python library for interactive plots and data applications in modern web browsers. Start with high-level plotting tools, then use layouts, widgets, and models when you need more control.
pip install bokeh
Common workflows
Build plots in Jupyter, publish them on a web page, or add Python callbacks with the Bokeh server.
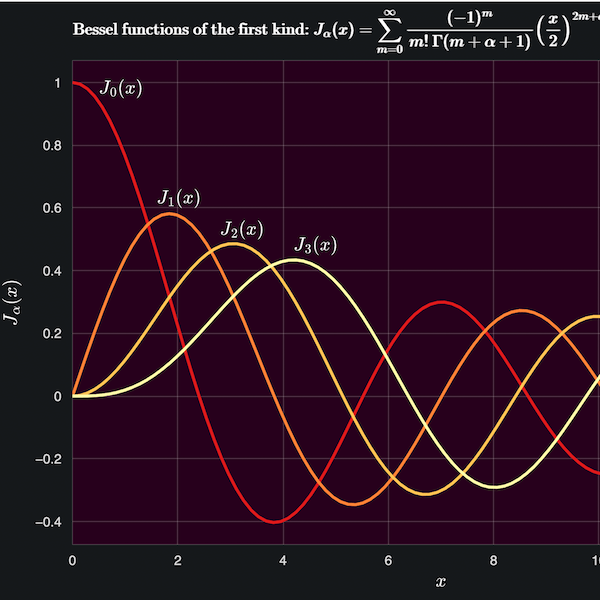
Place interactive plots beside your analysis in Jupyter notebooks and JupyterLab.
Use Bokeh in JupyterSave a standalone HTML file or embed a plot in an existing page. Neither option needs a Python server.
Publish and embed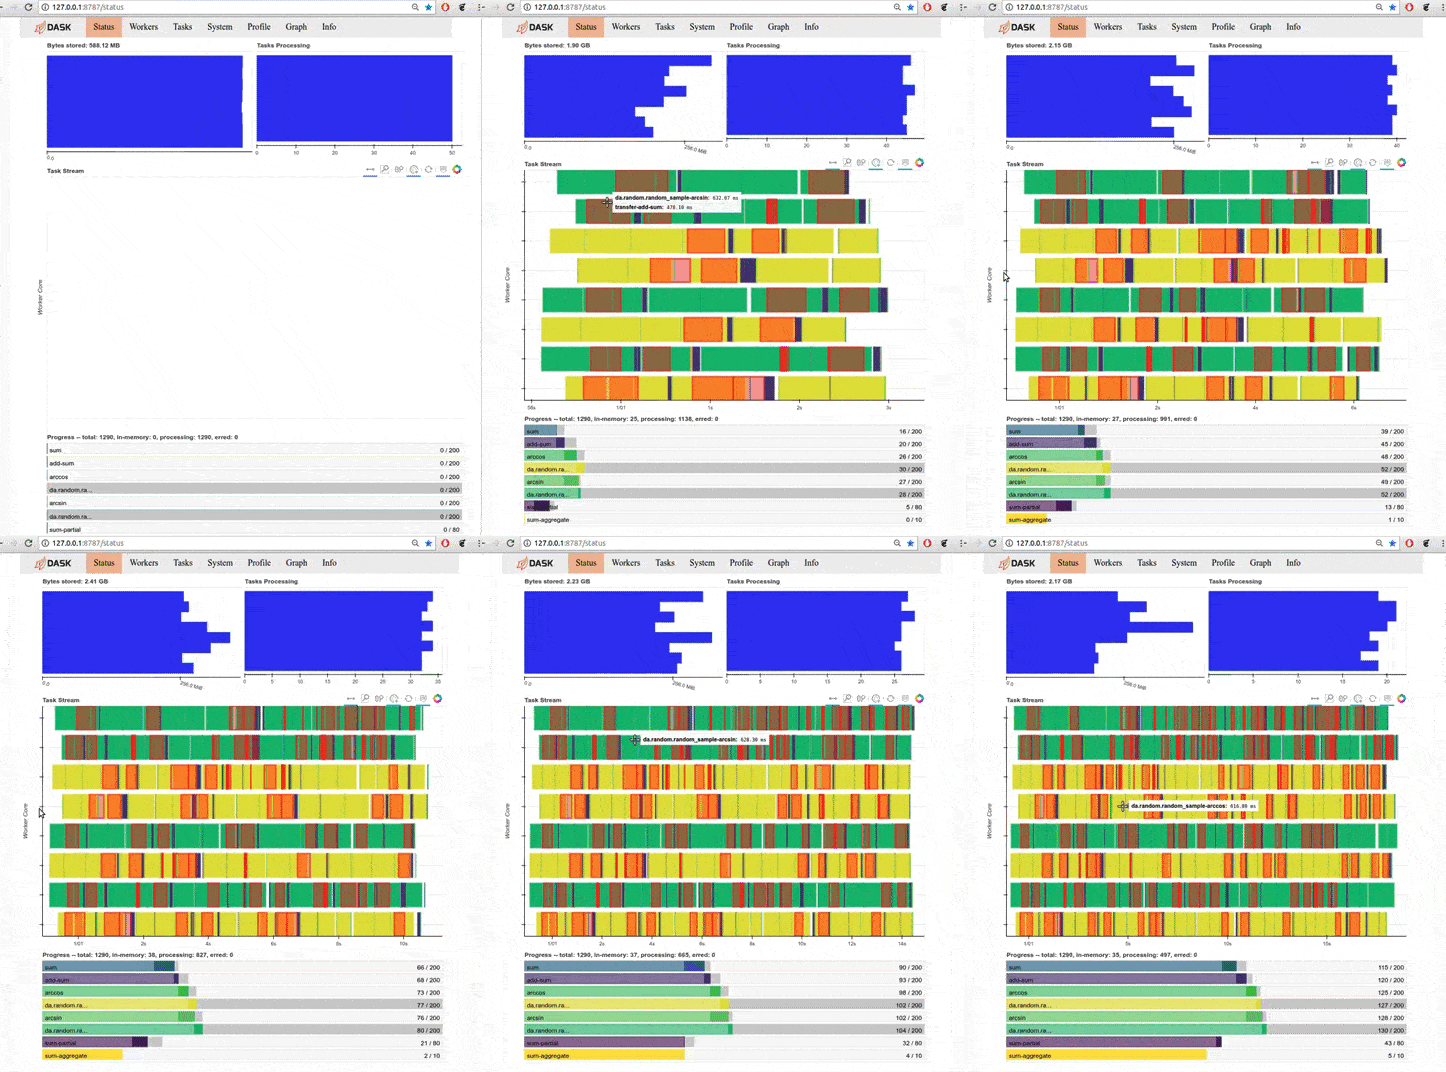
Mount Bokeh in FastAPI, Starlette, Django, or another ASGI app, and serve it with Uvicorn or Hypercorn. No separate Bokeh process is needed.
Use Bokeh with ASGIA small example
Bokeh handles rendering in the browser and provides tools for pan, zoom, hover, and selection.
See the first steps01 from bokeh.plotting import figure, show
02
03 x = [1, 2, 3, 4, 5]
04 y = [6, 7, 2, 4, 5]
05
06 p = figure("A first Bokeh plot")
07 p.line(x, y, line_width=3)
08 p.scatter(x, y, size=9)
09 show(p)Bokeh at a glance
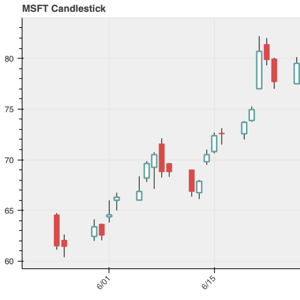
Use bokeh.plotting to make a first chart. For a custom application, work directly with plots, widgets, layouts, and other Bokeh models.
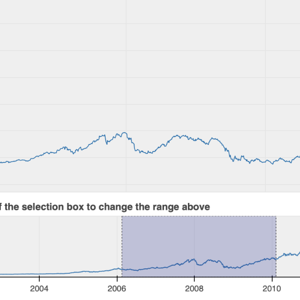
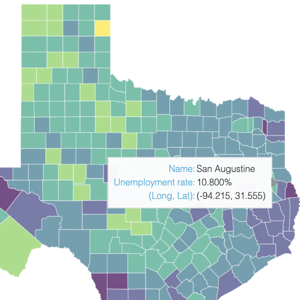
Bokeh plots include tools for pan, zoom, hover, selection, linking, filtering, and editable data.
Start with bokeh.plotting, then use layouts, widgets, annotations, models, themes, and extensions as needed.
Stream or patch data without replacing the full data source. Supported glyphs can use WebGL acceleration.
Show plots in notebooks, save standalone HTML, embed components in a web app, or run a Bokeh server.
Live demos
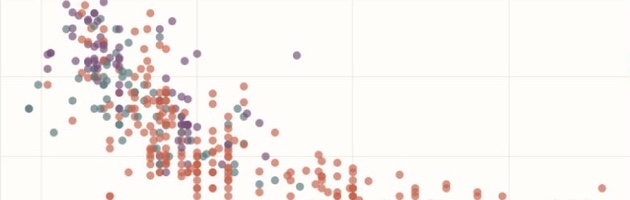
Select a group in the scatter plot to update its fuel economy distribution and summary values.
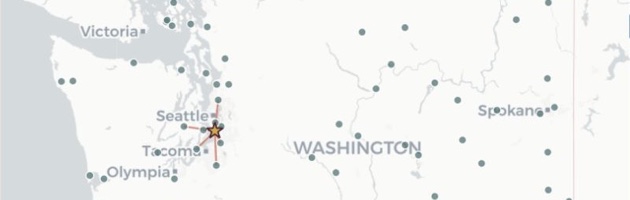
Choose a state or territory, then select an airport to find its closest alternatives.
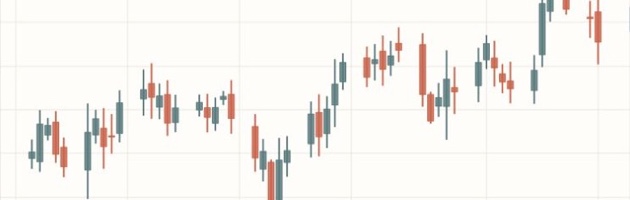
Generate an intraday OHLC stream, change its market regime, and watch volatility, drawdown, and MACD update.
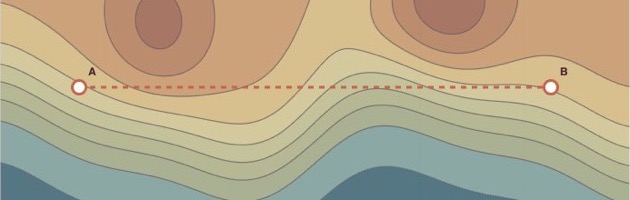
Position the transect to update its elevation profile and terrain statistics.
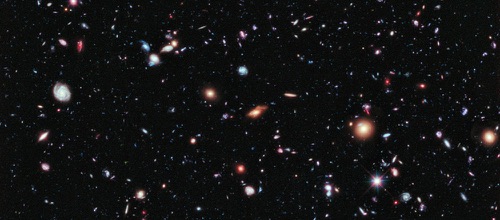
Crop the image and apply compiled color, contrast, blur, edge, and sharpening filters.
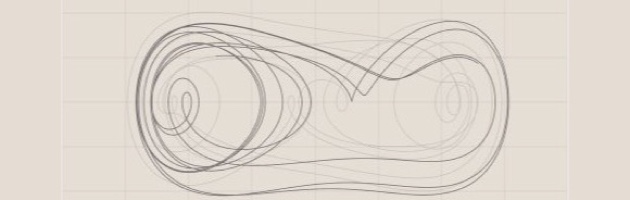
Switch among four models, then compare their traces, phase paths, and diagnostics.
User showcase
Dask, Panel, Mistic, and ArviZ use Bokeh for browser graphics, interaction, or application infrastructure.
The Dask diagnostics dashboard uses Bokeh to show task progress, memory, CPU, data transfer, and worker activity.
Visit projectPanel builds on Bokeh browser models and the Bokeh server, adding its own layouts, widgets, and application APIs.
Visit projectMistic uses Bokeh canvases and linked interactions to compare multiplex images and investigate image t-SNE embeddings.
Visit projectArviZ includes a Bokeh backend for interactive posterior analysis, statistical graphics, and notebooks.
Visit projectOpen source
Bokeh is a fiscally sponsored NumFOCUS project, built and maintained by contributors on GitHub.